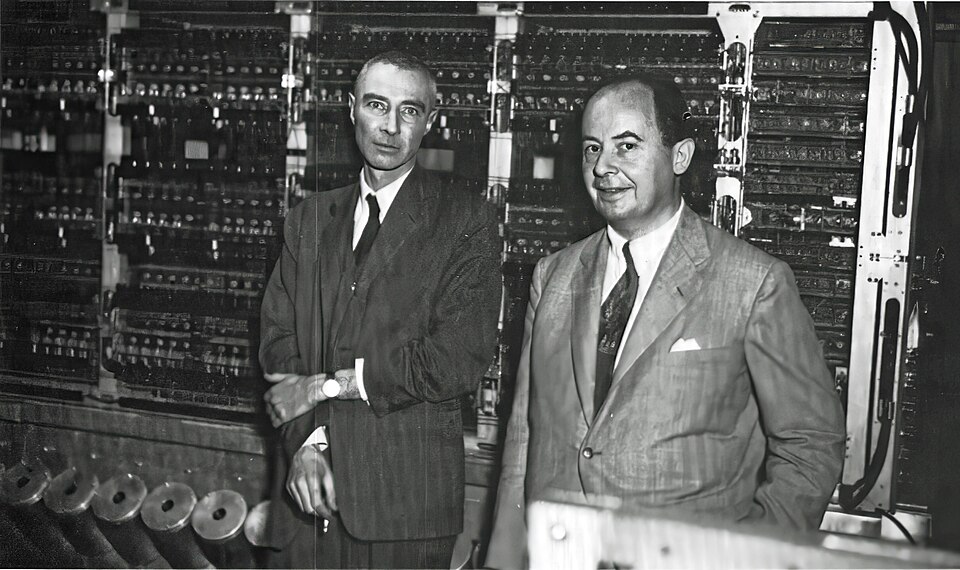
John von Neumann (right) helped popularize the stored-program concept in the 1940s, which is the basis of modern computer architecture.
Assignment 3 - Prefetcher Design and Analysis
- Assignment 3 - Prefetcher Design and Analysis
- Github Clone Link
- Goals
- Champsim Simulator
- 450/750 Students
- Report Preparation
- Check Yourself
- Prefetcher Stats
- Task 1. L1 vs L2 Prefetching
- Task 2. Baseline Strided Prefetcher
- Check yourself
- What you need to implement
- Q3. Vary the PT size from 64, 128, 256, 512, 1024. How does it influence performance and prefetch accuracy?
- Q4. Vary the prefetch depth (degree) from 1-16 (powers of 2, i.e., use degrees 1, 2, 4, 8, 16). How does it influence performance and prefetch accuracy?
- Q5. Plot a histogram of strides. Does it change over time?
- Task 3. Global History Stride Prefetcher
- Algorithm
- Q6. Compare the Strided Prefetcher (from Q3) against the Global History Stride Prefetcher (same size: 256 entries) in terms of performance and prefetch accuracy.
- Q7. Simulate the GHB prefetcher with different prefetch degrees (1, 2, 4, 8, 16). How does the degree influence execution performance and prefetch accuracy?
- Task 4. Feedback GHB (750 students only)
- Q8. Compare the feedback prefetcher against the Global history prefetcher (same size: 256 entries) in terms of performance, prefetch accuracy, and usefulness (i.e., fraction of useful prefetches).
- Q9. Create a histogram of prefetch depth in a table. How many entries have a distance between 4-8, 8-12 etc. Compare against GHB with fixed degree (2,4) and distance (4,16,32).
- Q10. Plot the useless prefetches for GHB with 16 and 32 vs Feedback GHB. How does it impact performance?
- Grading criteria
- Acknowledgments
Github Clone Link
Goals
In this assignment you will explore the effectiveness of hardware prefetchers on an actual program. Your task is to use the SPEC2017 benchmarks’ traces to evaluate the effectiveness of a few real-life prefetching schemes. The objective is to compare different prefetching algorithms in a common framework.
Champsim Simulator
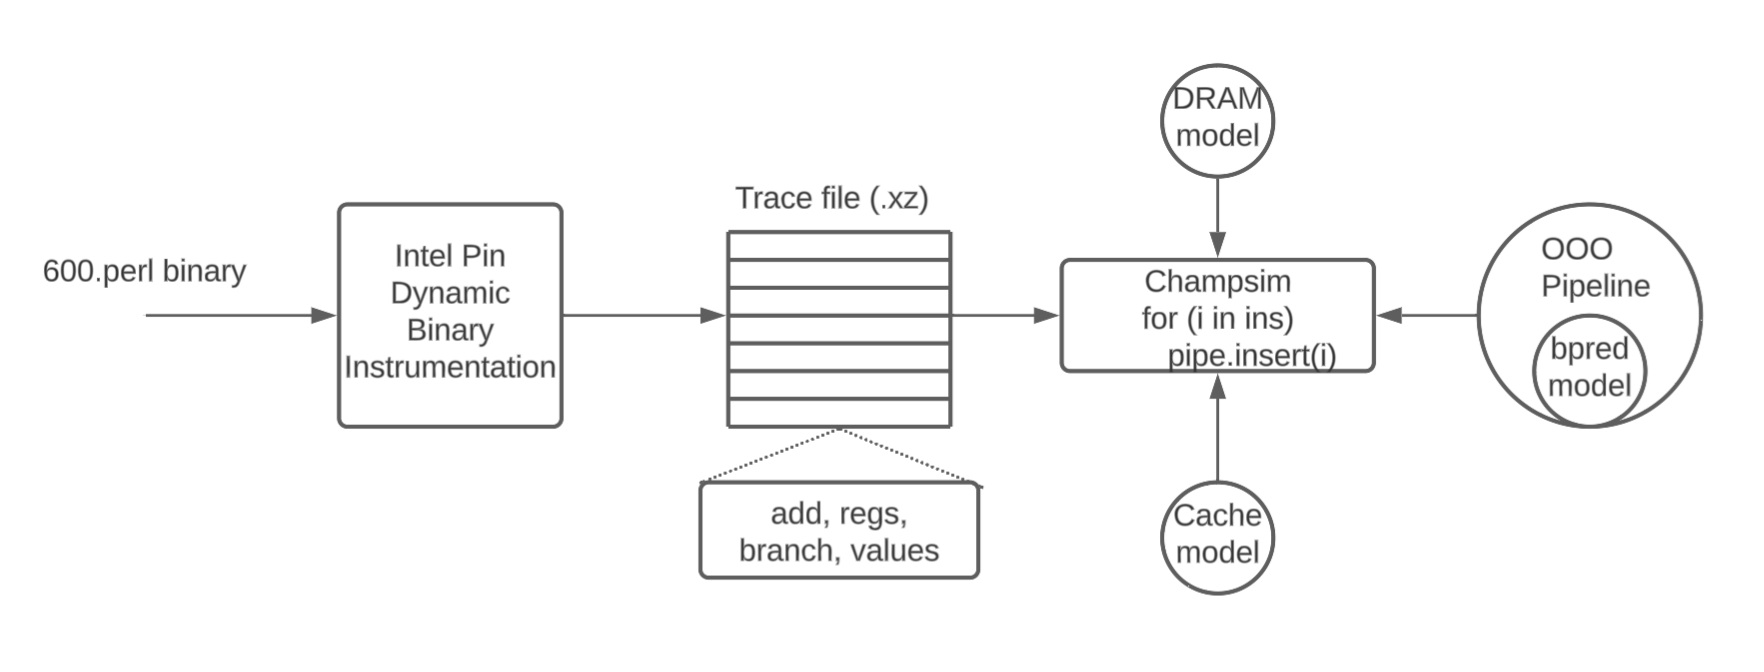
ChampSim is a trace-based function-first simulator used for microarchitecture studies. Trace-based (Champsim) vs Timing-First or (gem5)
ChampSim takes five parameters: Branch predictor, L1D prefetcher, L2C prefetcher, LLC replacement policy, and the number of cores (We will only be using a single core). For example,
$ cd $REPO
#  builds a single-core processor with perceptron predictor, L1 prefetcher
#  next_line, no L2 or L3 prefetcher, and baseline LRU policy for LLC
$ ./build_champsim.sh perceptron next_line no no lru 1
# Builds l2 prefetcher, disables l1 prefetcher
$ ./build_champsim.sh perceptron no next_line no lru 1

# Link to spec 2017 traces
$ export TRACE_DIR=/data/dpc3_traces/
$ export CHAMPSIM_BINARY=perceptron-next_line-no-no-lru-1core
$ ./run_champsim.sh $CHAMPSIM_BINARY 5 50 607.cactuBSSN_s-2421B.champsimtrace.xz
# This will take about 1-2 minutes. Actual runs you will have to use 50 million
# warmup 150 million simulation. When debugging try at most 1 million instructions
# before moving onto longer simulations. Result file will be
# "results_${N_SIM}M" as a form of "${TRACE}-${BINARY}-${OPTION}.txt".
| Param | Description |
|---|---|
| 5 | number of instructions for warmup (5 million). For actual Qs below use 50 |
| 50 | number of instructions for detailed simulation (50 million). For actual Qs below use 150 |
Results will be stored in results_${N_SIM}M/ directory. For example, to see the results of the above command:
$ cat results_50M/607.cactuBSSN_s-2421B.champsimtrace.xz-$CHAMPSIM_BINARY.txt
Add Your Own Prefetcher
The /prefetcher directory is where you will implement custom prefetchers. ChampSim supports prefetchers at all cache levels, but this assignment focuses on L2 prefetchers. The L2 prefetcher API is defined in l2c_prefetcher.cc and consists of five key functions:
-
l2c_prefetcher_initialize: Called when the L2 cache is created. Use this to initialize internal prefetcher data structures. -
l2c_prefetcher_operate: Called for each L2 lookup (load/store, hit/miss). In this assignment, you will focus on finding patterns only in L2 accesses. The first and second arguments provide the cacheline aligned address and the PC of the memory access, respectively. The third argument indicates whether the access is a hit or miss in the L2 cache, and the fourth argument indicates whether the access is a load or store. The last argument is metadata associated with the cache block, which you can ignore for this assignment (simply return it as-is). You can use this function to track access patterns and make prefetching decisions. -
l2c_prefetcher_cache_fill: Called for each L2 fill operation. Argument names are self-explanatory. -
l2c_prefetcher_final_stats: Called at simulation end. Use this to print prefetcher statistics. -
prefetch_line: You do not need to implement this function, but use it to inject prefetch requests. The first two arguments are the PC and cacheline address triggering the prefetch; the third is the prefetch address. By default, prefetch requests look up cache level N and higher, then main memory on miss. The fourth argument (per fill level) controls where prefetched data is filled: For an L2 prefetcher, it can either beFILL_L2(prefetched data is filled into L2) orFILL_LLC(prefetched data is filled into LLC).
Your Prefetcher
To implement your own prefetcher, create a new file with prefetcher_name.l2c_pref naming format and provide custom implementations for the four API functions in C++. If you do not need to use any specific function, simply define the function with an empty body. Please do not modify l2c_prefetcher.cc by yourself. The build script will automatically generate the appropriate l2c_prefetcher.cc file using your l2c_pref file and link it with the ChampSim model.
To help you get started, we have provided a simple prefetcher implementation: next-line prefetcher, which is taken from the 3rd Data Prefetching Championship and can be found in next_line.l2c_pref. This file file should give you a brief understanding of how to implement a prefetcher. We have also provided an empty L2 prefetcher in no.l2c_pref to simulate a system without any prefetcher.
cp prefetcher/no.l2c_pref prefetcher/myl2cpref.pref
Each prefetcher needs to at least implement 3 handlers
// Class definition for prefetcher.
// Class definition for stats collection
// Global variable for prefetching
// Global variable for stats

// Initialize the prefetcher state e.g., LRU counters for entries, Hysterisis
// counters for entries, etc.
void CACHE::l2c_prefetcher_initialize()
{
}

// Called on every L2 cache access (both hits and misses)
// Parameters:
//   addr: The cache block address being accessed
//   ip: The program counter (PC) of the load/store instruction
//   cache_hit: 1 if the access hits in L2 cache, 0 if it misses
//   type: The access type (0 = load, 1 = store)
//   metadata_in: metadata associated with the cache block (ignore, simply return it)
// Return: metadata_in (must be returned as-is)
uint32_t CACHE::l2c_prefetcher_operate(uint64_t addr, uint64_t ip,
                                       uint8_t cache_hit, uint8_t type,
                                       uint32_t metadata_in)
{
  return metadata_in;
}

// Called when a cache line is filled (whether by prefetch or demand access)
// Parameters:
//   addr: address of the cache line being filled
//   set: cache set index where the line is placed
//   way: cache way index where the line is placed
//   prefetch: indicates if this fill was due to a prefetch (1) or demand access (0)
//   evicted_addr: address of the cache line that was evicted (if any)
//   metadata_in: metadata associated with the cache line (ignore, simply return it)
// Note: You typically don't need to modify this function, but you can use it
// to track prefetch effectiveness and gather statistics.
uint32_t CACHE::l2c_prefetcher_cache_fill(uint64_t addr, uint32_t set,
                                          uint32_t way, uint8_t prefetch,
                                          uint64_t evicted_addr, uint32_t metadata_in)
{
  return metadata_in;
}

// Print the stats of the prefetcher at the end of simulation. You can use this
// function to print any overall statistics of the prefetcher that you have
// collected during the simulation.
void CACHE::l2c_prefetcher_final_stats()
{
}
450/750 Students
The report will be prepared in markdown. For each of the questions below experiment with 50 million warmup instructions and 150 million detailed simulation instructions.
- 450 students can do in groups of up to two students.
- Only one person has to create the repository. You can add the other person in settings after you create the repository.
Report Preparation
Two formats for the report file. REPORT.md and REPORT.pdf. REPORT.md will be the file you fill out Convert REPORT.md to REPORT.pdf Organize all your plots into the plots folder Submit your REPORT.pdf on canvas at https://canvas.sfu.ca/courses/1369/assignments/70678
- Reports will be prepared in markdown
- You can export markdown to pdf using Markdown Visual Studio to PDF
- Report files will be named REPORT.md and REPORT.pdf
- REPORT.pdf should be submitted on Canvas
You should run simulations using the following traces:
- 602.gcc_s-734B.champsimtrace.xz
- 605.mcf_s-665B.champsimtrace.xz
- 607.cactuBSSN_s-2421B.champsimtrace.xz
- 628.pop2_s-17B.champsimtrace.xz
- 638.imagick_s-10316B.champsimtrace.xz
- 649.fotonik3d_s-1176B.champsimtrace.xz
Check Yourself
Do not proceed without comprehending these bullets. Refresh the material below and attent an instructor OH if you are not able to answer any of these questions.
- Do you know how to mask and extract bits from address? If not familiar, watch 295 video
- Do you know what is a direct mapped cache?
- If a hardware table is indexed by a K-bit index, how many entries does the table have?
- Do you know how to implement a saturation counter (e.g., 2-bit up/down saturating counter)?
- Do you know how to implement a state machine like the one on Slide 7 of Week2 Lecture Notes?
- Why do we skip the least significant two bits in the branch PC when indexing into a branch prediction table?
Prefetcher Stats
As we discussed in depth, prefetching is a speculation technique to predict a future memory request and fetch it into the caches before the processor core actually demands it. This prediction helps to hide the long latency of a DRAM-based main memory access and can make the program run faster.
The effectiveness of a prefetcher can be measured using four metrics:
- Performance: The execution cycles saved due to prefetcher (higher is better)
- Coverage: The fraction of the memory accesses saved by the prefetcher (e.g., reduction in number of memory accesses)
- Accuracy: The fraction of prefetched addresses that are actually needed later by the program (e.g., measures as the number of cache hits)
- Timeliness: The fraction of the latency of memory accesses hidden by the prefetcher (higher is better)
In a processor core with a traditional three-level cache hierarchy, a prefetcher can be employed at any level. For example, a prefetcher at the L2 cache level tries to capture the program access pattern by observing the accesses coming out from the L1 data cache and fills the prefetched cachelines up to the L2 cache level.
Task 1. L1 vs L2 Prefetching
In the first experiment, we will compare whether next-line prefetching at the L1 data cache is more effective than next-line prefetching at the L2 cache level. To do this, you will run two simulations:
Next-line prefetcher at the L1 data cache and no prefetcher at L2 cache:
$ ./build_champsim.sh perceptron next_line no no lru 1
No prefetcher at the L1 data cache and next-line prefetcher at L2 cache:
$ ./build_champsim.sh perceptron no next_line no lru 1
Q1. How much does performance improve if prefetching implemented at L1 vs L2. Why? (Hint: Check average miss latency, execution time, or IPC)
Q2. Did the useful and useless prefetches vary between the L1 prefetching and L2 prefetching?
Task 2. Baseline Strided Prefetcher
Check yourself
What you need to implement
The stride prefetcher described in this section is a simplified version of the basic stride prefetcher described in https://ieeexplore.ieee.org/document/381947?arnumber=381947. Several commercial processors (e.g., IBM Power 4) implement some version of this prefetcher. If you are interested in reading more, the paper is available on IEEE Xplore (accessible from SFU library).
A stride prefetcher predicts future memory addresses for a given load/store instruction by looking at that instruction’s past address history. It works well when an instruction repeatedly accesses memory with a constant stride (difference) between consecutive addresses. For instance, if a load instruction accesses addresses 100, 108, 116, and 124, the stride is 8 (i.e., the difference between consecutive addresses). The stride prefetcher would predict that the next address accessed by this instruction will be 132 (i.e., 124 + 8). The stride can also be negative, predicting a backward streaming pattern. Instead of tracking all memory accesses globally, it tracks patterns per instruction (per PC).
The stride prefetcher uses a Prefetch Tracker Table (PT) to remember the recent access behavior of each memory instruction. It’s organized as a direct-mapped cache indexed by the instruction’s PC. Each entry in the PT corresponds to a memory instruction. Figure 2 in the paper shows the design of the PT. The PT keeps track of previous addresses and associated strides for memory instructions. The PT is updated on every memory access and the prefetching decision is made based on the state of the instruction entry in the PT after the update. Each entry has the following format (see Figure 2 in the paper):
- tag: the tag corresponding to the address of the memory instruction (i.e., PC)
- prev-addr: the last address referenced by the corresponding instruction
- stride: the difference between the last two addresses that were generated by the corresponding PC (can be negative)
- state: a two-bit encoding (four states) of the past history
The four states and the transitions between them are depicted in Figure. The four states are:
- initial: set at first entry in the PT or after the entry experienced a different stride from the steady state one.
- transient: corresponds to the case when the system is not sure whether the current stride is stable
- steady: indicates that the prediction should be stable for a while.
- no-prediction: disables the prefetching for this entry for the time being.
PT records the address of the memory instruction, computes the stride for that access, and sets a state controlling the prefetching by comparing the previously recorded stride with the one just computed. The stride information is obtained by taking the difference between the addresses of the two most recent accesses for the same instruction.
When a load/store instruction is encountered for the first time, the instruction is entered in the PT in the initial state (potentially “evicting” an existing entry that maps to the same PT entry). When the stride is obtained for the first time, i.e., at the second access, the state is set to transient since it is not known yet whether the pattern will be regular or irregular. When a further stride is computed and, if it is equal to the one previously recorded, i.e., if the same stride has occurred twice in a row, then the entry will be set to the steady state. It will remain in the steady state until a different stride is detected. At that point, the state is reset to initial.
If a different stride is computed while in the transient state, the entry is set to the no-prediction state since the pattern is not regular and erroneous prefetching should be prevented. In the presence of irregular patterns, the state of the entry will either stay in the no-prediction state or oscillate between the transient and no-prediction states until a regular stride is detected.
The PT is updated for an instruction that accesses a memory location at address addr as follows:
- Scenario 1. There is no corresponding entry in the PT. The instruction is entered in the PT, the prev-addr field is set to addr, the stride to 0, and the state to initial. This may involve replacing an existing entry (with a different tag) that maps to the same PT entry.
- Scenario 2. There is a corresponding entry. The new stride is computed as
addr - prev-addr. Depending on the current state of the entry and whether the new stride is equal to the stride in the PT the transitions depicted in Figure 2a are performed. The following table further explains what happens in each transition. In the table, by Stride Condition “false” we mean the new stride is different than the stride recorded in the PT, and by “true” we mean the same stride is observed. Once the transition to the new state is performed, the prev-addr is set to addr.
| STATE | STRIDE CONDITION | NEW STATE | NEW STRIDE |
|---|---|---|---|
| initial | true | steady | no change |
| initial | false | transient | update |
| transient | true | steady | no change |
| transient | false | no-prediction | update |
| steady | true | steady | no change |
| steady | false | initial | no change |
| no-prediction | true | transient | no change |
| no-prediction | false | no-prediction | update |
Following the update, a prefetch is generated depending on the state of the entry. If the entry is
in one of these states (init, transient or steady), a prefetch for the next address in the stride pattern
is generated, provided the cache line/block is not already present in the cache (i.e., a prefetch for
address addr + stride).
NOTE Assume that on initialization, all tags in the PT are zero to indicate that the entries in the PT are empty. The executable to be simulated starts at higher addresses, so this assumption is safe. When indexing in the PT, make sure you discard the lower bits in the PC that are always zero.
NOTE Implement the prefetcher at the L2 cache level. In all your simulations *for this task, use the next-line prefetcher at the L1 data cache to capture the *spatial locality and your stride prefetcher at the L2 cache to capture the *temporal locality. This will help you to evaluate the effectiveness of your *stride prefetcher in capturing the temporal patterns that are not captured by *the next-line prefetcher.
Q3. Vary the PT size from 64, 128, 256, 512, 1024. How does it influence performance and prefetch accuracy?
Q4. Vary the prefetch depth (degree) from 1-16 (powers of 2, i.e., use degrees 1, 2, 4, 8, 16). How does it influence performance and prefetch accuracy?
Q5. Plot a histogram of strides. Does it change over time?
- Every ten million accesses, check what are the strides detected in the valid entries then create a histogram from these stride values (counting how many times each stride is repeated). You don’t need to plot all the strides, but show the most common ones (e.g., top 10) and how they change over time.
Task 3. Global History Stride Prefetcher
Your goal is to implement a Global History Buffer (GHB) based stride prefetcher GHB Paper at the L2 cache by using the prefetcher API. The GHB decouples the index tag from the stride tracker.
- Index Table (IT): A table that is indexed by program properties, like PC (program counter), and that stores a pointer to a GHB entry.
- Global History Buffer (GHB): A circular queue that stores time-ordered sequence of the observed cacheline addresses. Each GHB entry also stores a pointer (called prev ptr) that points to the last cacheline address that has the same IT index. By traversing prev ptr, one can get the temporal sequence of cacheline addresses that points to the same IT entry.
Algorithm
- For each L2 cache access (both hit and miss), the algorithm uses the PC of the access to index into the IT and insert the cacheline address (say A) into the GHB.
- Using the PC and the link pointers in GHB entries, the algorithm retrieves the sequence of last 3 addresses by this PC that accessed the L2 cache.
- The stride is computed by taking the difference between two consecutive addresses in the sequence.
- If two strides match (say d), the prefetcher simply issues prefetch requests to cachelines A+ld,A+(l+1)d,A+(l+2)d,…,A+(l+n)d, where l is the prefetch look-ahead and n is the prefetch degree.
- For your design, please statically set both l and n to 4.
- Please also size the IT and GHB so that they are 256 entries each.
- For further details read the paper.
NOTE Just like the stride prefetcher, implement the GHB prefetcher at the L2 *cache level. In all your simulations for this task, use the next-line *prefetcher at the L1 data cache to capture the spatial locality and your GHB *prefetcher at the L2 cache to capture the temporal locality.
Q6. Compare the Strided Prefetcher (from Q3) against the Global History Stride Prefetcher (same size: 256 entries) in terms of performance and prefetch accuracy.
Q7. Simulate the GHB prefetcher with different prefetch degrees (1, 2, 4, 8, 16). How does the degree influence execution performance and prefetch accuracy?
Task 4. Feedback GHB (750 students only)
Your second task is to incorporate feedback information to evaluate the effectiveness of the prefetcher in the system and accordingly adjust the prefetcher’s aggressiveness. Srinath et al. propose a mechanism that incorporates dynamic feedback into the design of the prefetcher to increase the performance improvement provided by prefetching as well as to reduce the negative performance and bandwidth impact of prefetching.
You need to extend the prefetcher you designed in GHB using a simplified version of Srinath et al.’s feedback directed mechanism. The two dynamic feedback metrics you need to incorporate into the GHB prefetcher are described below. The counters are implemented within the cache struct (see cache.h), access as ooo_cpu[i].L2C..... See main.cc for stats printed out with pf_...
-
Prefetch Accuracy: Prefetch accuracy is a measure of how accurately the prefetcher can predict the memory addresses that will be accessed by the program. $\text{Prefetch Accuracy} = \frac{\text{Number of Useful Prefetches}}{\text{Number of Prefetches Sent to Memory}}$ where the $\text{Number of Useful Prefetches}$ is the number of prefetched cache blocks that are used by demand requests while they are resident in the L2 cache. Your goal is to implement the mechanism that calculates the prefetch accuracy as described in Section 3.1.1 of Srinath et al.
-
Prefetch Lateness Prefetch lateness is a measure of how timely the prefetch requests generated by the prefetcher are with respect to the demand accesses that need the prefetched data. A prefetch is defined to be late if the prefetched data has not yet returned from main memory by the time a load or store instruction requests the prefetched data. $\text{Prefetch Lateness} = \frac{\text{Number of Late Prefetches}}{\text{Number of Useful Prefetches}}$. In general, prefetch lateness decreases as the prefetcher becomes more aggressive. Your goal is to implement the mechanism that calculates the prefetch lateness as described in Section 3.1.2 of the Srinath et al.
The feedback information should be collected every 200 memory operations. Based on the collected feedback you need to update a counter that tunes the aggressiveness of the GHB prefetcher based on the information provided in tables below. The prefetch distance is defined in Srinath et al. in Section 2.1. The threshold values which define the accuracy and the lateness of the prefetcher can be found in Section 4.3 in Srinath et al.. You should not implement the changes in the cache insertion policy proposed in Srinath et al..
Table 1: Prefetcher aggressiveness configurations
| Counter | Aggressiveness | Distance | Degree |
|---|---|---|---|
| 1 | Very Conservative | 4 | 1 |
| 2 | Conservative | 8 | 1 |
| 3 | Middle-of-the-Road | 16 | 2 |
| 4 | Aggressive | 32 | 4 |
| 5 | Very Aggressive | 48 | 4 |
Table 2. Feedback counter updates based on prefetch accuracy and lateness.
| Case | Prefetch Accuracy | Prefetch Lateness | Counter Update |
|---|---|---|---|
| 1 | High | Late | Increment |
| 2 | High | Not-Late | No Change |
| 3 | Medium | Late | Increase |
| 4 | Medium | Not-Late | No Change |
| 5 | Low | Late | Decrement |
| 6 | Low | Not-Late | No Change |
Q8. Compare the feedback prefetcher against the Global history prefetcher (same size: 256 entries) in terms of performance, prefetch accuracy, and usefulness (i.e., fraction of useful prefetches).
Q9. Create a histogram of prefetch depth in a table. How many entries have a distance between 4-8, 8-12 etc. Compare against GHB with fixed degree (2,4) and distance (4,16,32).
Q10. Plot the useless prefetches for GHB with 16 and 32 vs Feedback GHB. How does it impact performance?
Grading criteria
- Answer the questions in REPORT.md and convert it to REPORT.pdf. Submit REPORT.pdf on canvas and commit REPORT.md to your repository.
- If you do not include plots for each question it will simply be zeroed out. Please do not just include a data dump without any analysis.
- The total assignment is worth a 100 points equally split among mandatory questions.
- You also need to include a README in your repo with instructions on which commands to run to generate results and plots.
Acknowledgments
This assignment has been modified by the CMPT 450/750 instructors.